On-Off Contested Shooting Impact
Next Article: Deep dive on player archetypes using the data generated here
Motivation
How should we measure playmaking in basketball? The ability to get teammates good shots can be as valuable as scoring the ball yourself, but assists numbers only capture part of the picture. They don't capture the intangible ability of a point guard to manipulate the defense or the way a center can force a defense to contract with the threat of post scoring. Do traditional “floor-stretchers” really provide spacing the way we have been led to believe? What is “gravity”, and can we quantify it? The analytics world has started to catch up to these questions with the advancement of tracking data, but most attempts at capturing these phenomena tend to be math-forward and hard to interpret. Coaches may have an intuitive sense of how players impact their teammates, but how can we as analysts show them data to back those feelings. I encountered this while self-scouting this season, and I have found an uncomplicated solution that is an extension of an existing, accepted technique: on/off impact metrics.
On/Off statistics have become widely utilized in basketball analytics to compare how a team performs with a player on the court versus when they are on the bench. Often you will see these statistics in relation to a team's offensive, defensive, and net ratings, and across a sufficient sample this is indeed a very powerful tool for assessing player impact. However, on/off statistics can be applied to all indicators of team performance. Assessing on/off impact across rebounding, turnovers, defensive FG%, and other statistics has been instrumental in my work with the Concordia University coaching staff. We use this data to assess how our players affect play style, and armed with that information we can make strategic substitutions based on team needs across in-game situations.
Making on/off statistics for box-score stats available has become common-place in the analytics world, even though their team rating counterparts remain the most popular of these metrics. With basic play-by-play data these comparisons are relatively easy to complete. This season working with Concordia I decided to take this a step further. Since I collect data on how contested shots are, I figured I would be able to apply this process to assess player impact on shot quality.
Data
The data that I will be using for this is the data that I collect and use for the Concordia team, which is play-by-play in the form of csv files with each row associated with an event. However, I don't record assists, rebounds or fouls: only turnovers, shots, and substitutions get an independent row, with other contextual statistics recorded in a column for additional notes. The columns of each row are quarter, time, possession_id, player, event, event_type, shotclock, set, additional_tags, and lineup. This provides me with a log of every possession, the shots taken, the plays that were run, and how the possession ended (either in a missed/made shot or a turnover).
Since this exercise concerns shooting data, here's a detailed breakdown of the data I collect for shots
specifically. Obviously the player column contains the number of the player who took the shot, with a
negative
sign preceding the number if it was taken by Concordia's opponent. Event contains a string: the code
for the
shot's location, contest level and result. To record shot locations I partition the court into nine zones and
write z followed by the zone's code. I record the contest level, which I determine visually using criteria from
the Concordia coaching staff, by writing a c then contest code: wide-open (c1), open (c2), contested (c3),
heavily-contested (c4). Then if the shot is missed I append an “m” to the string. For example: “c3z1m” is a
contested attempt within the restricted area that is missed, or “c2z5” is an open left corner 3 made.
Event_type
records context on the shot, ie “catch and shoot”, “drive”, “stepback”, etc…
Keeping track of this data
enables
me to create quick shot charts to measure efficieny and shot quality:
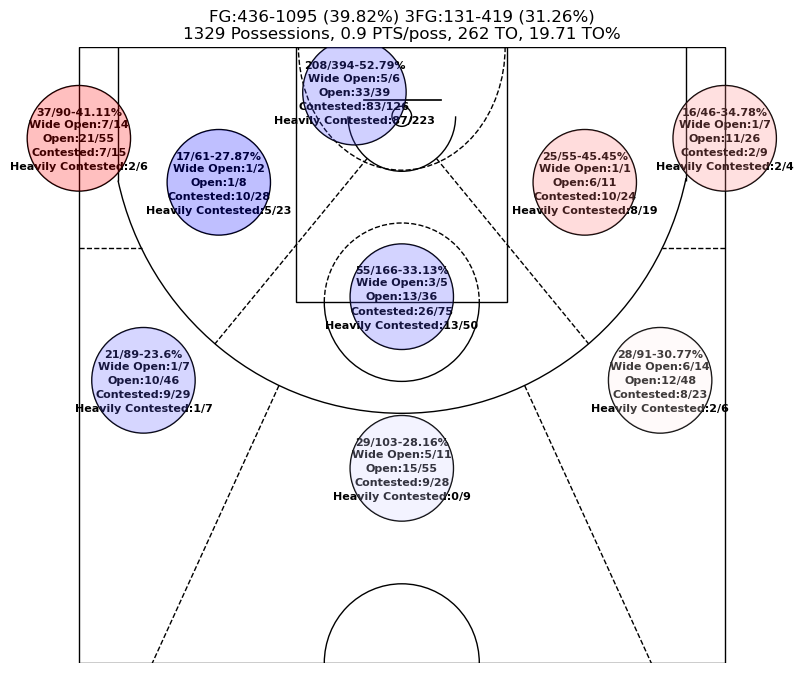
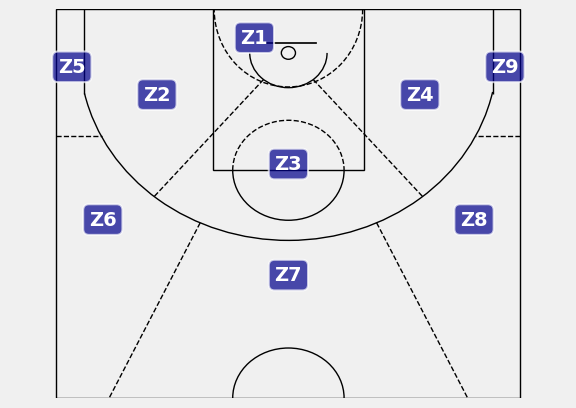
Methodology
Our goal is to compare shot quality with a player on vs off the court, this can be done in a couple of ways. First, by just computing what percentage of team shots are wide-open, open, contested, or heavily-contested when that player is on the court then repeating the process for when the player is off the court and subtracting the results. This provides a good baseline assessment of on/off team shot quality. Next we want to analyze impact on the team, so we exclude shots that were taken by the player we are computing the statistic for. This helps eliminate noise for players who take a lot of contested shots, and highlights their impact on others.
Finally we want to examine jump shooting specifically since the large majority of attempts near the rim are contested, and this trend will remain the same across all players. To this end, we exclude shots around the restricted area and repeat the processes above. What we are left with is the percentage change in attempt% across each contest level for all jump shots the players teammates took while they were on/off the court.
Results
Here are the resulting statistics, along with the differences in FG%, 2FG%, and 3FG% across the shots considered. Since the attempt% numbers are a change in frequency of shots across contest levels, the differences sum to zero. For privacy and competition's sake, I have anonymized the players' names. We interpret this data by saying: when Player A was on the court, the proportion of his teammates' shots that were wide-open decreased by 3.54% and the proportion of shots that were heavily contested increased by 4.45%, but 3-point field goal percentage was 3.58% better.
-Nick