Using NBA Tracking Data to Visualize Plays
In this article I am going to demonstrate how we can use NBA tracking data to make surface level observations about plays in basketball. To do this I have selected two plays that occured on subsequent possessions during the Cavs vs Warriors 2015 Christmas day game. I have previously used these plays as examples for my 2>3 project, and I will admit they are a little cherry picked to illustrate my point in that project. The code used to generate these images can be found here.
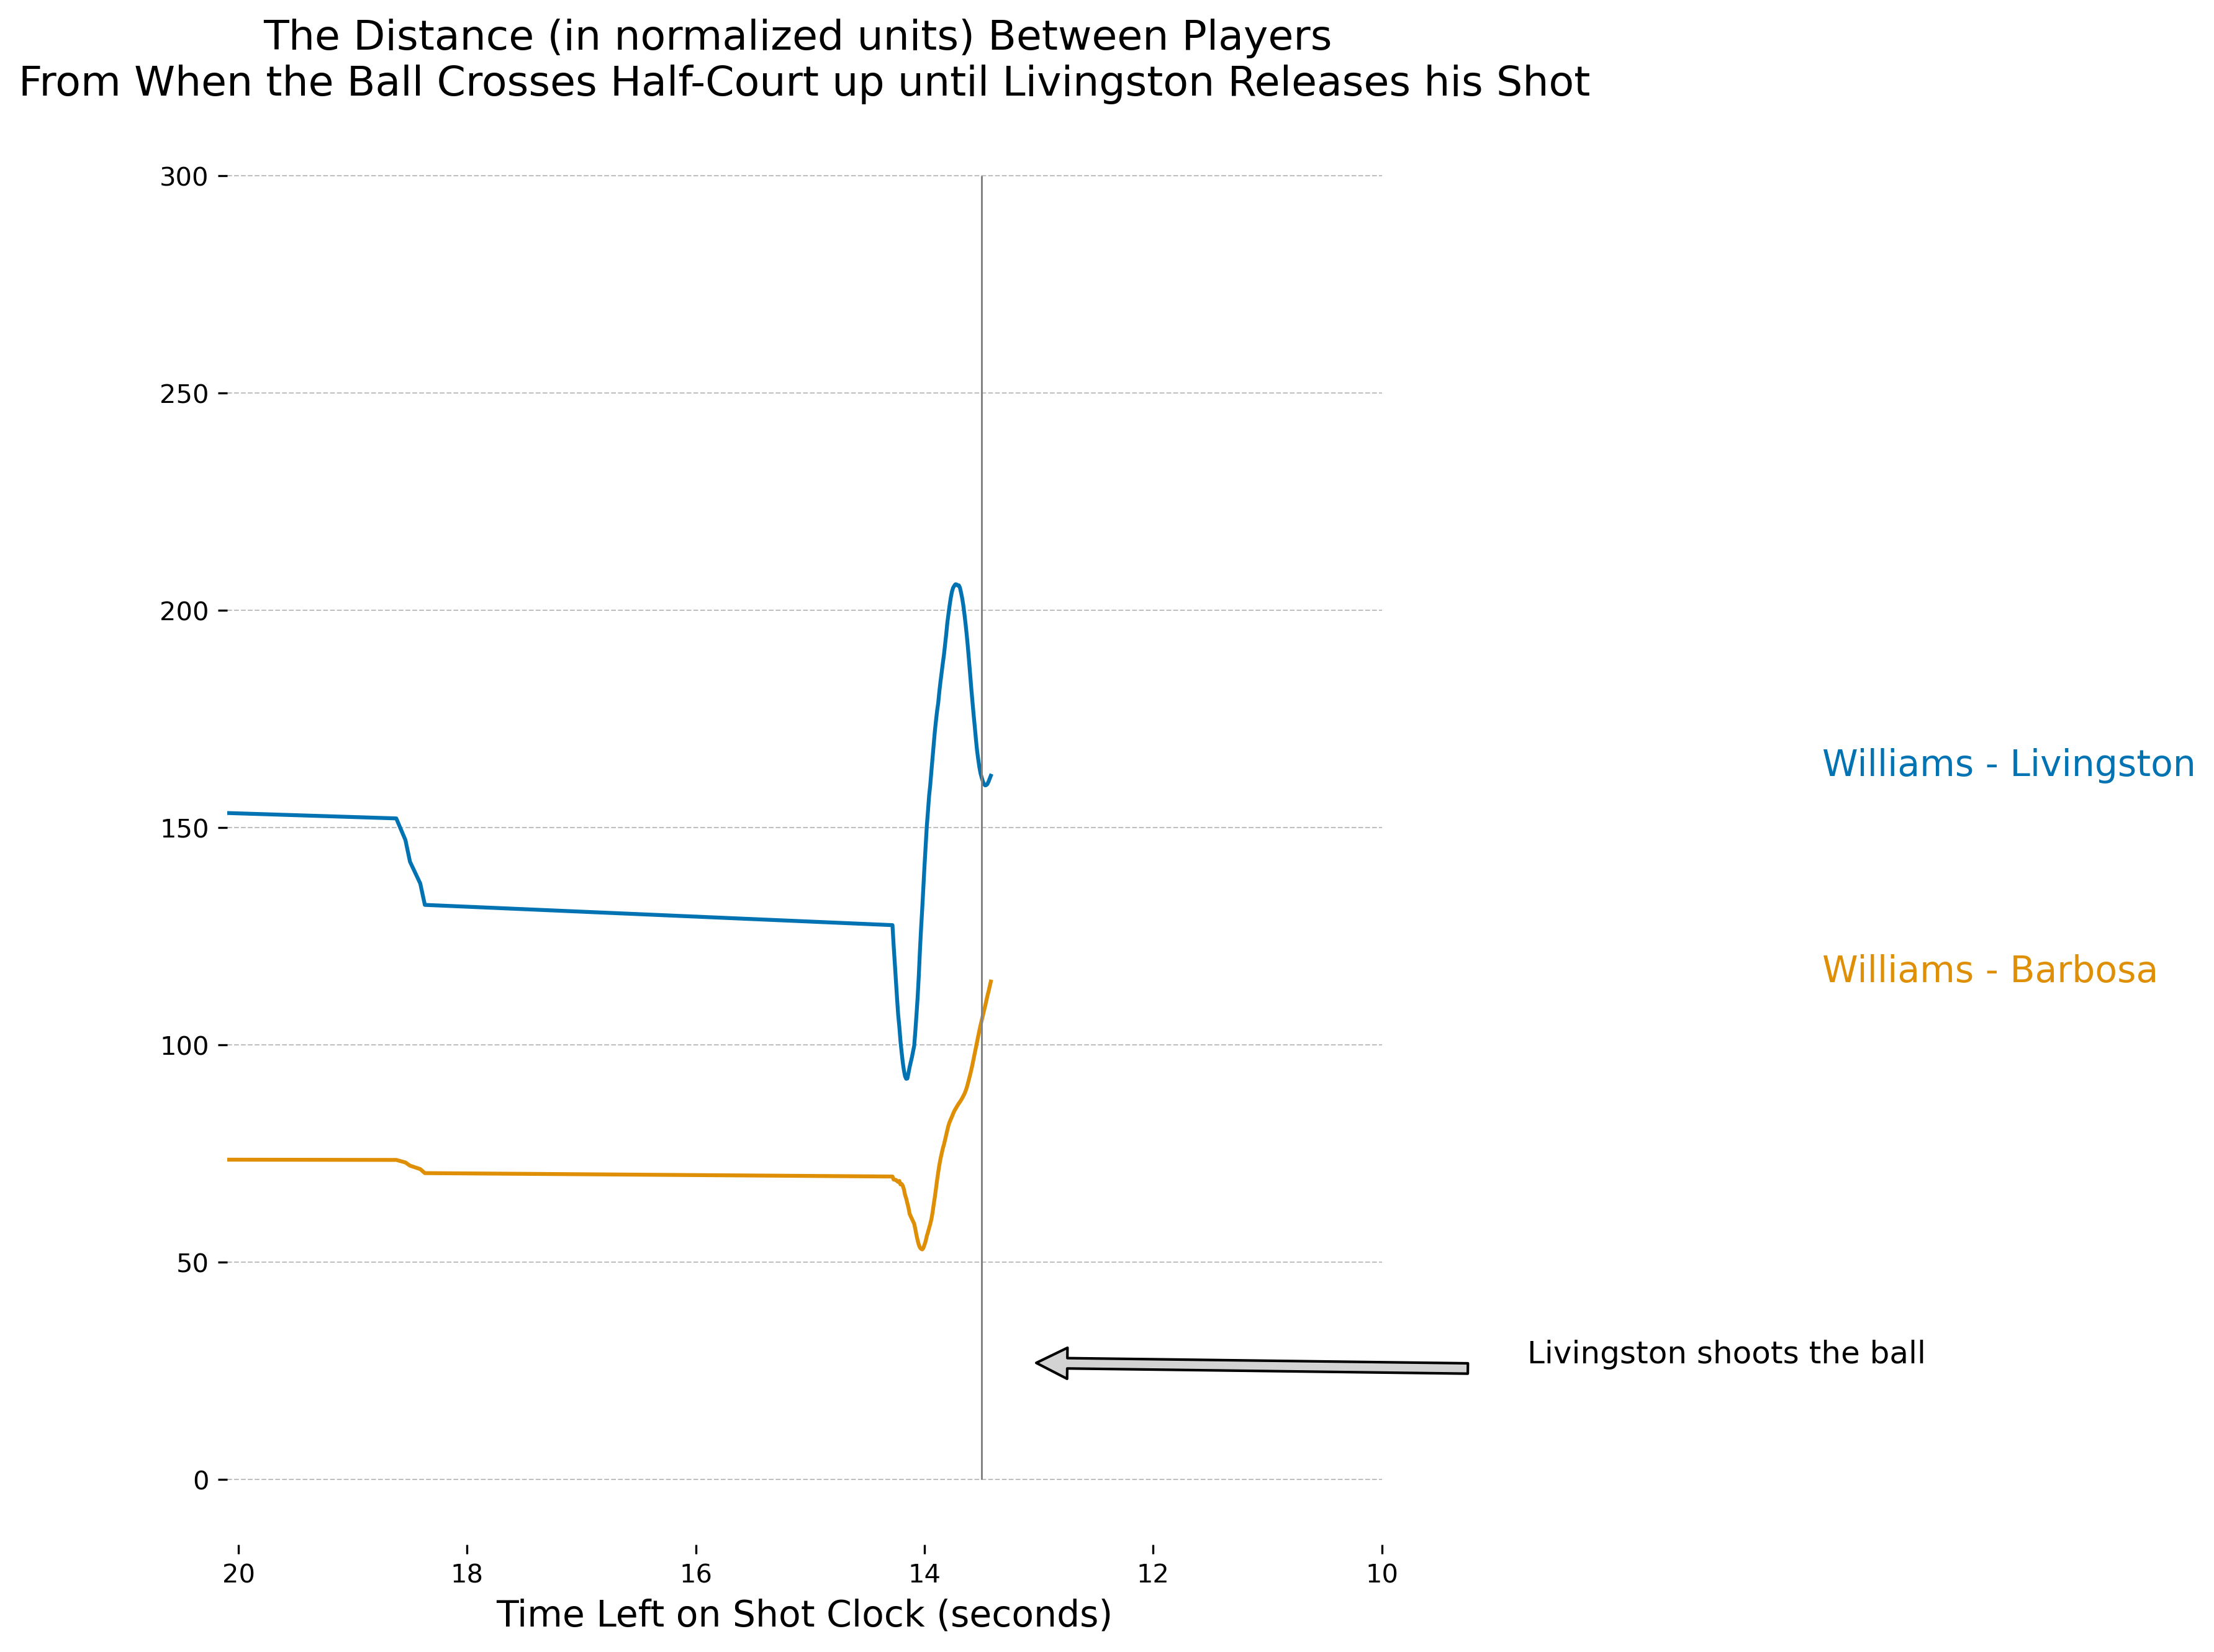
The first play is a midrange jumper taken by Shaun Livingston, one of the best midrange shooters of the modern era. Leandro Barbosa sets a screen for Livingston before moving towards the top of the 3-points arc to provide a shooting threat. Mo William is caught in the action cheating towards Livingston.
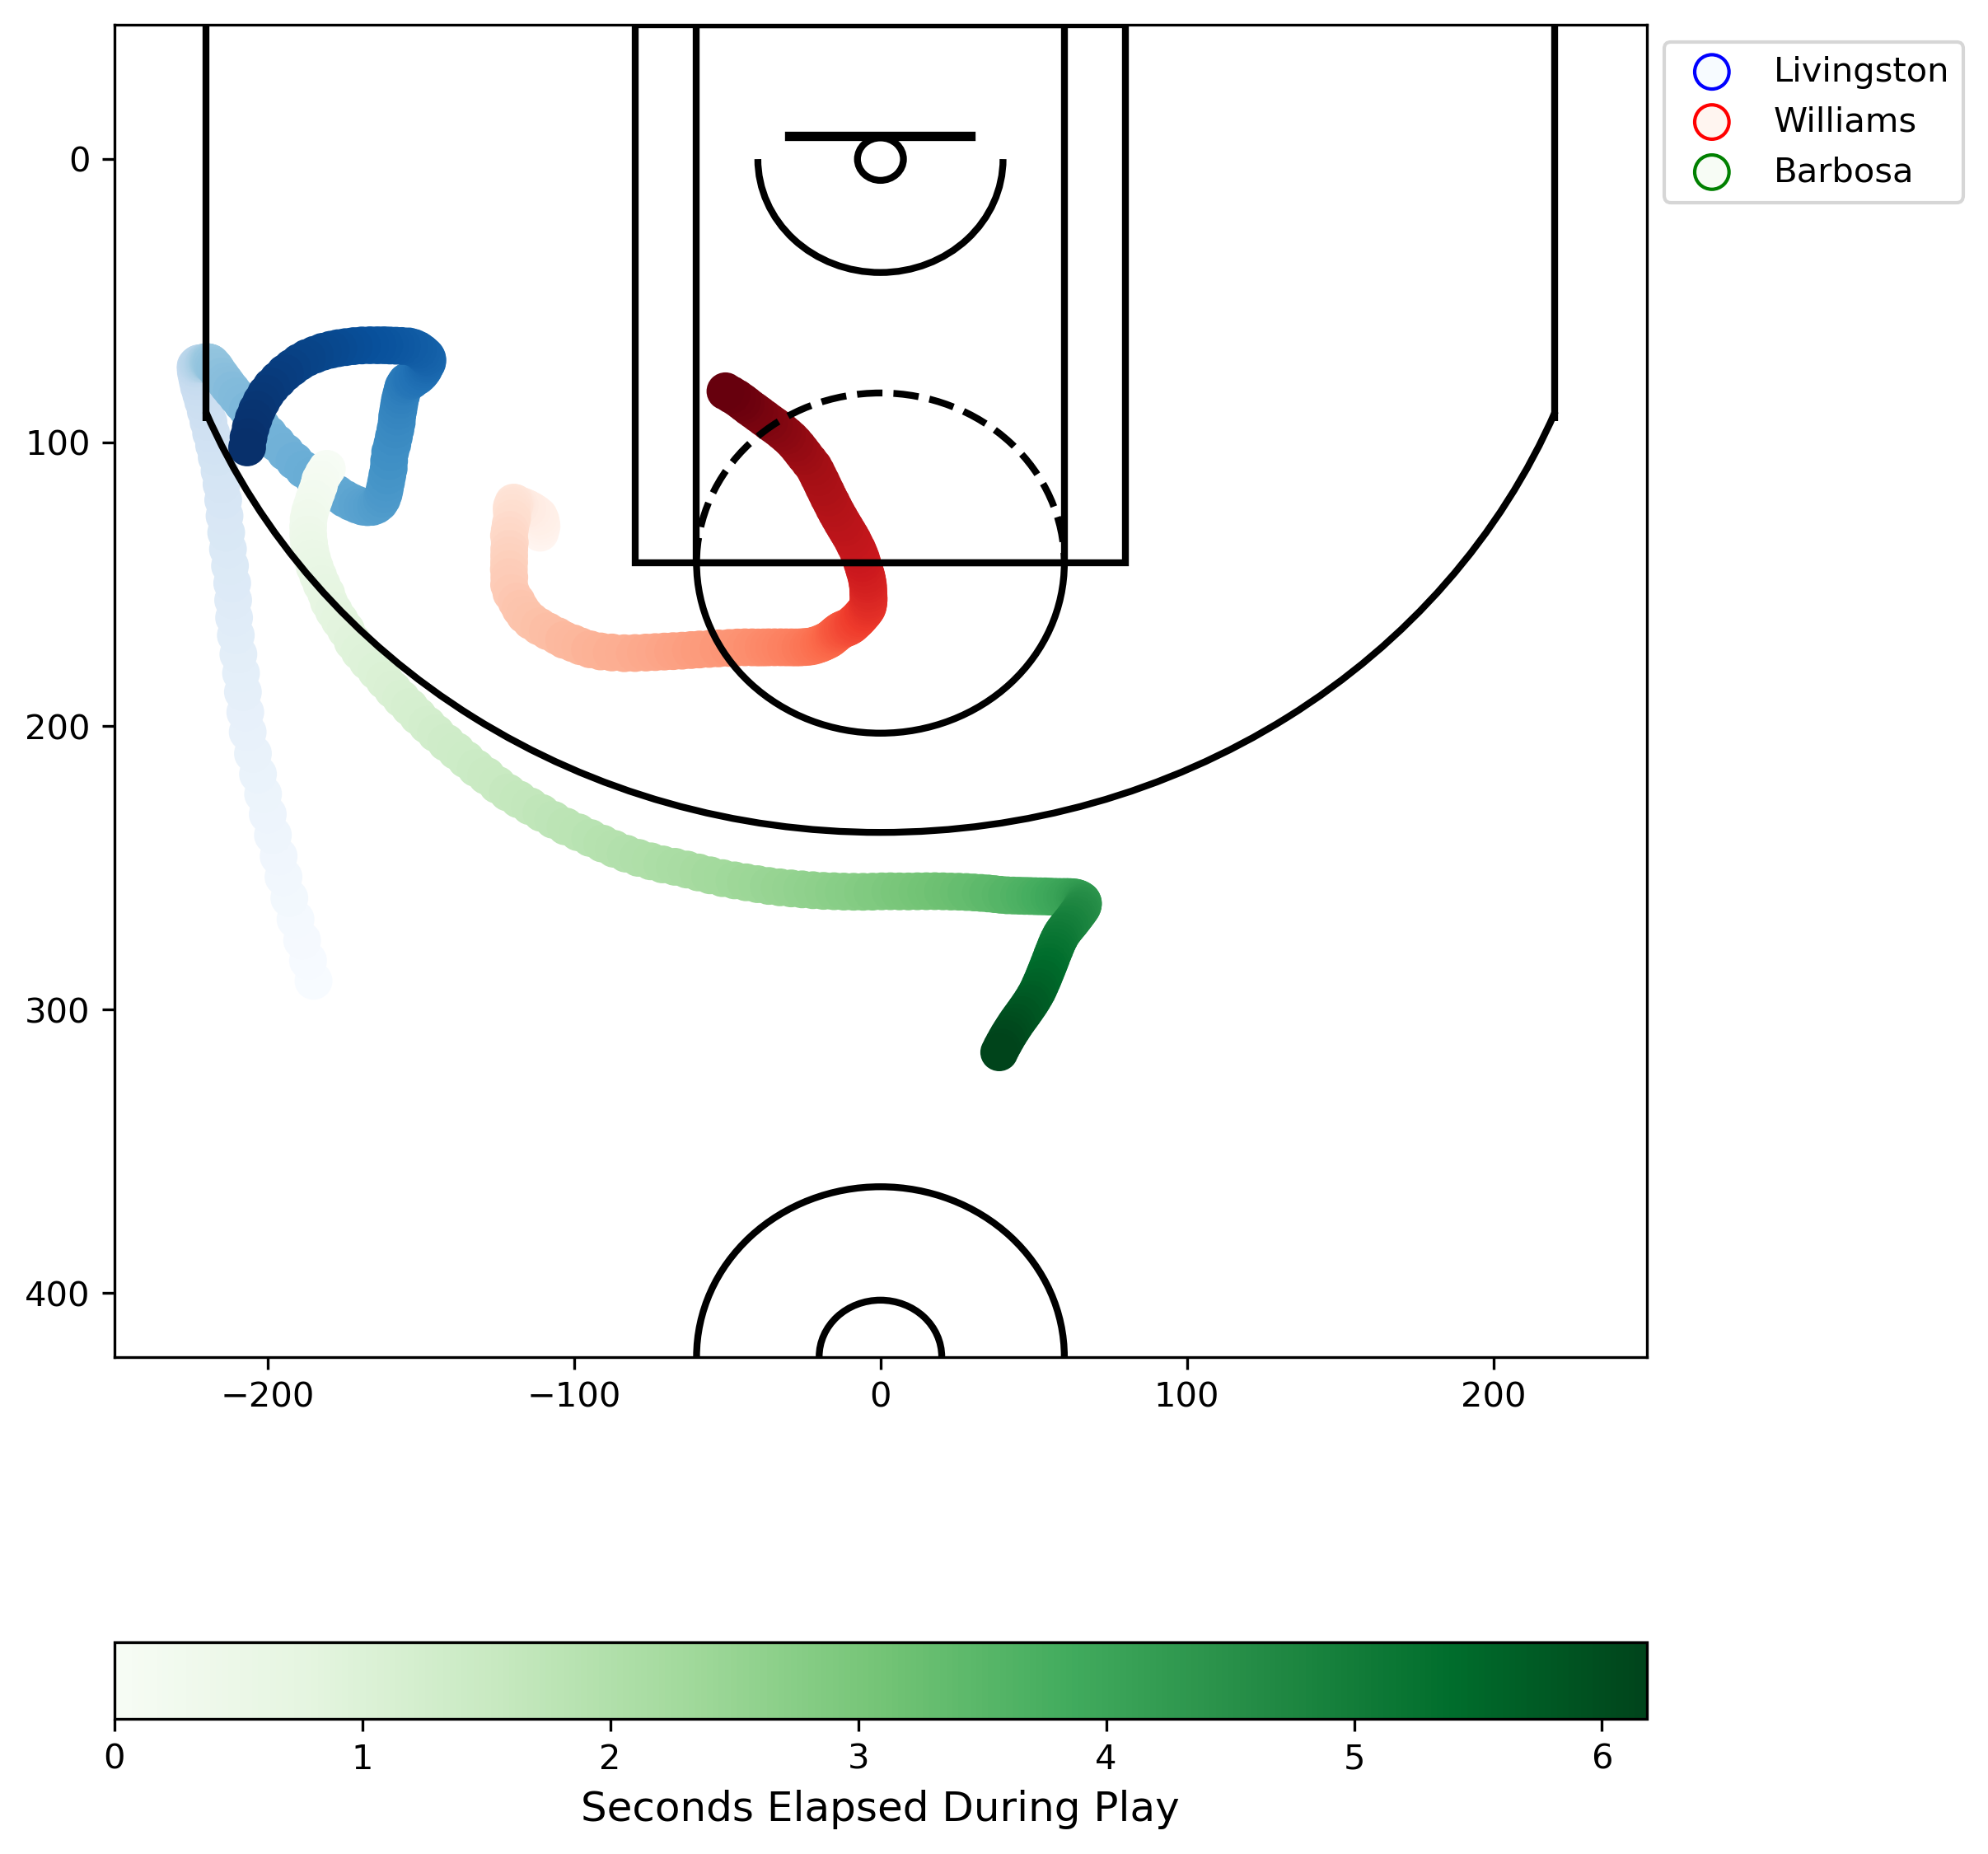
By looking at the distance between the players we can visualize this defensive lapse by Williams! In this data set 10 normalized units are eqaul to 1 foot.
On the second play, Livingston gets the ball in a similar position on the other side of the court. This time it's Iman Shumpert who gets caught out of position by the threat of Livingston's jumper, leaving Andre Iguodala wide open at the top of the 3-point arc.
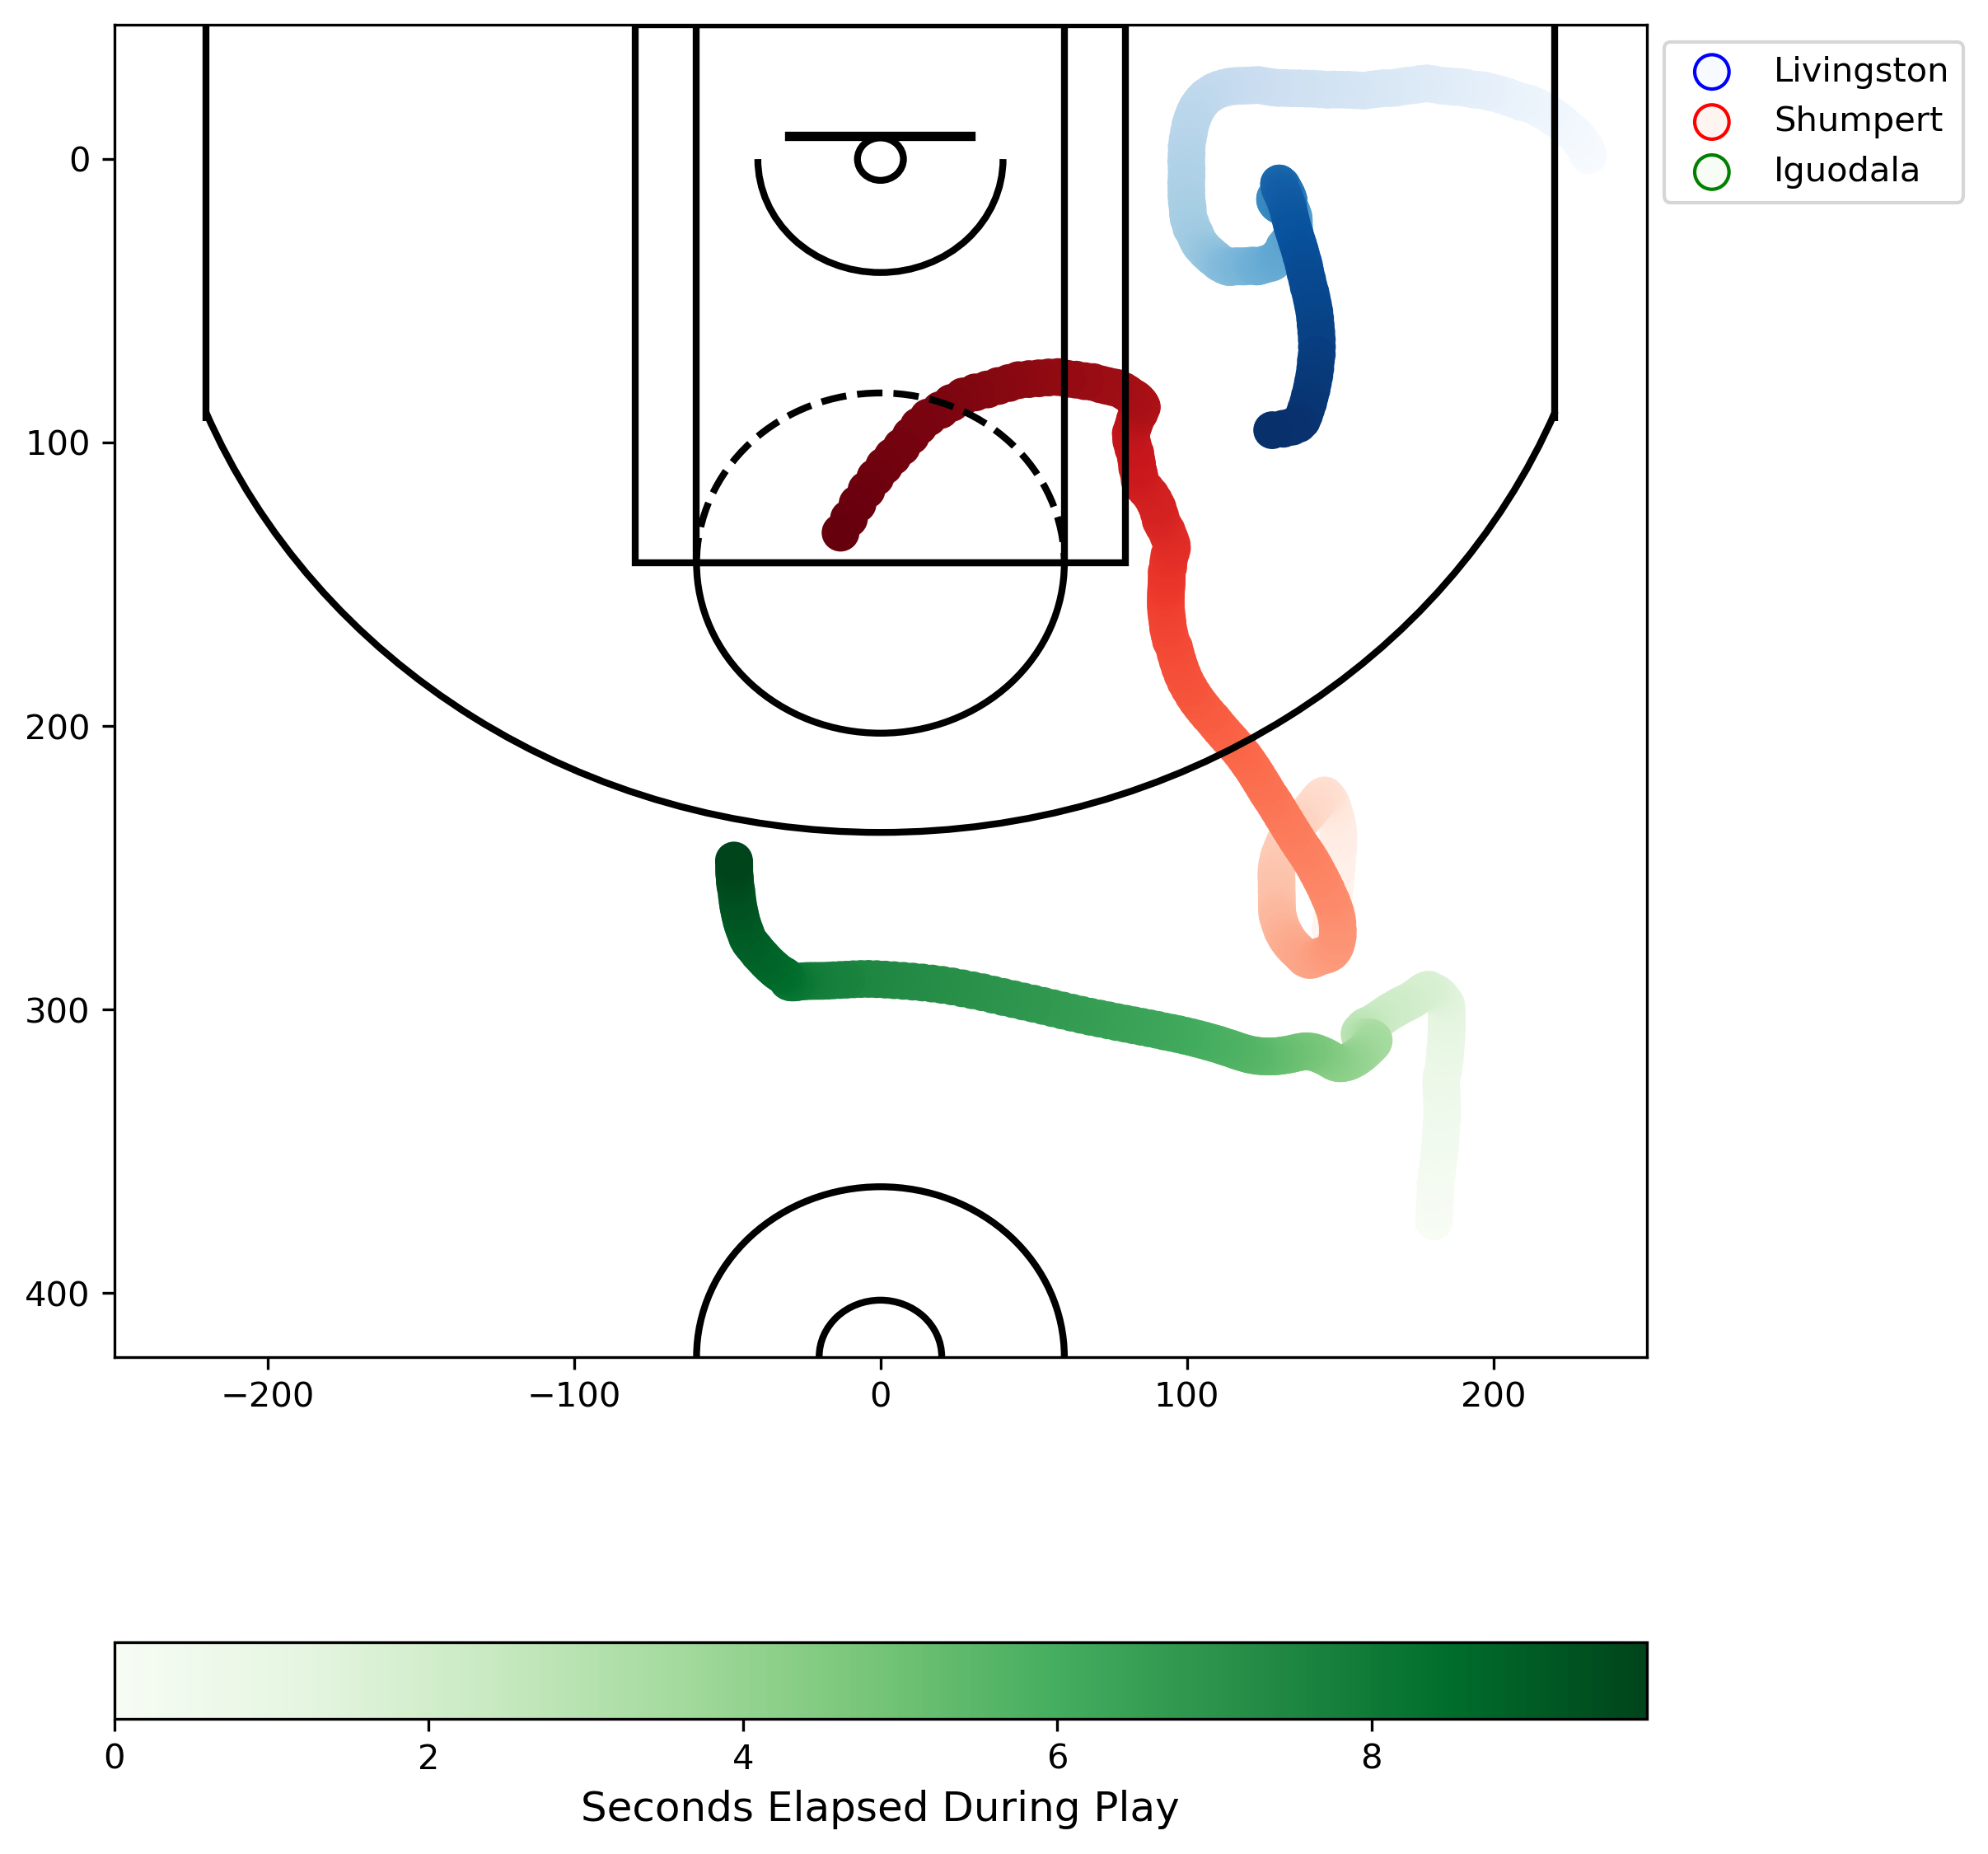
We can see the way that Shumpert gets caught up and tries to recover to the shooter in the plot of distances between players as well!
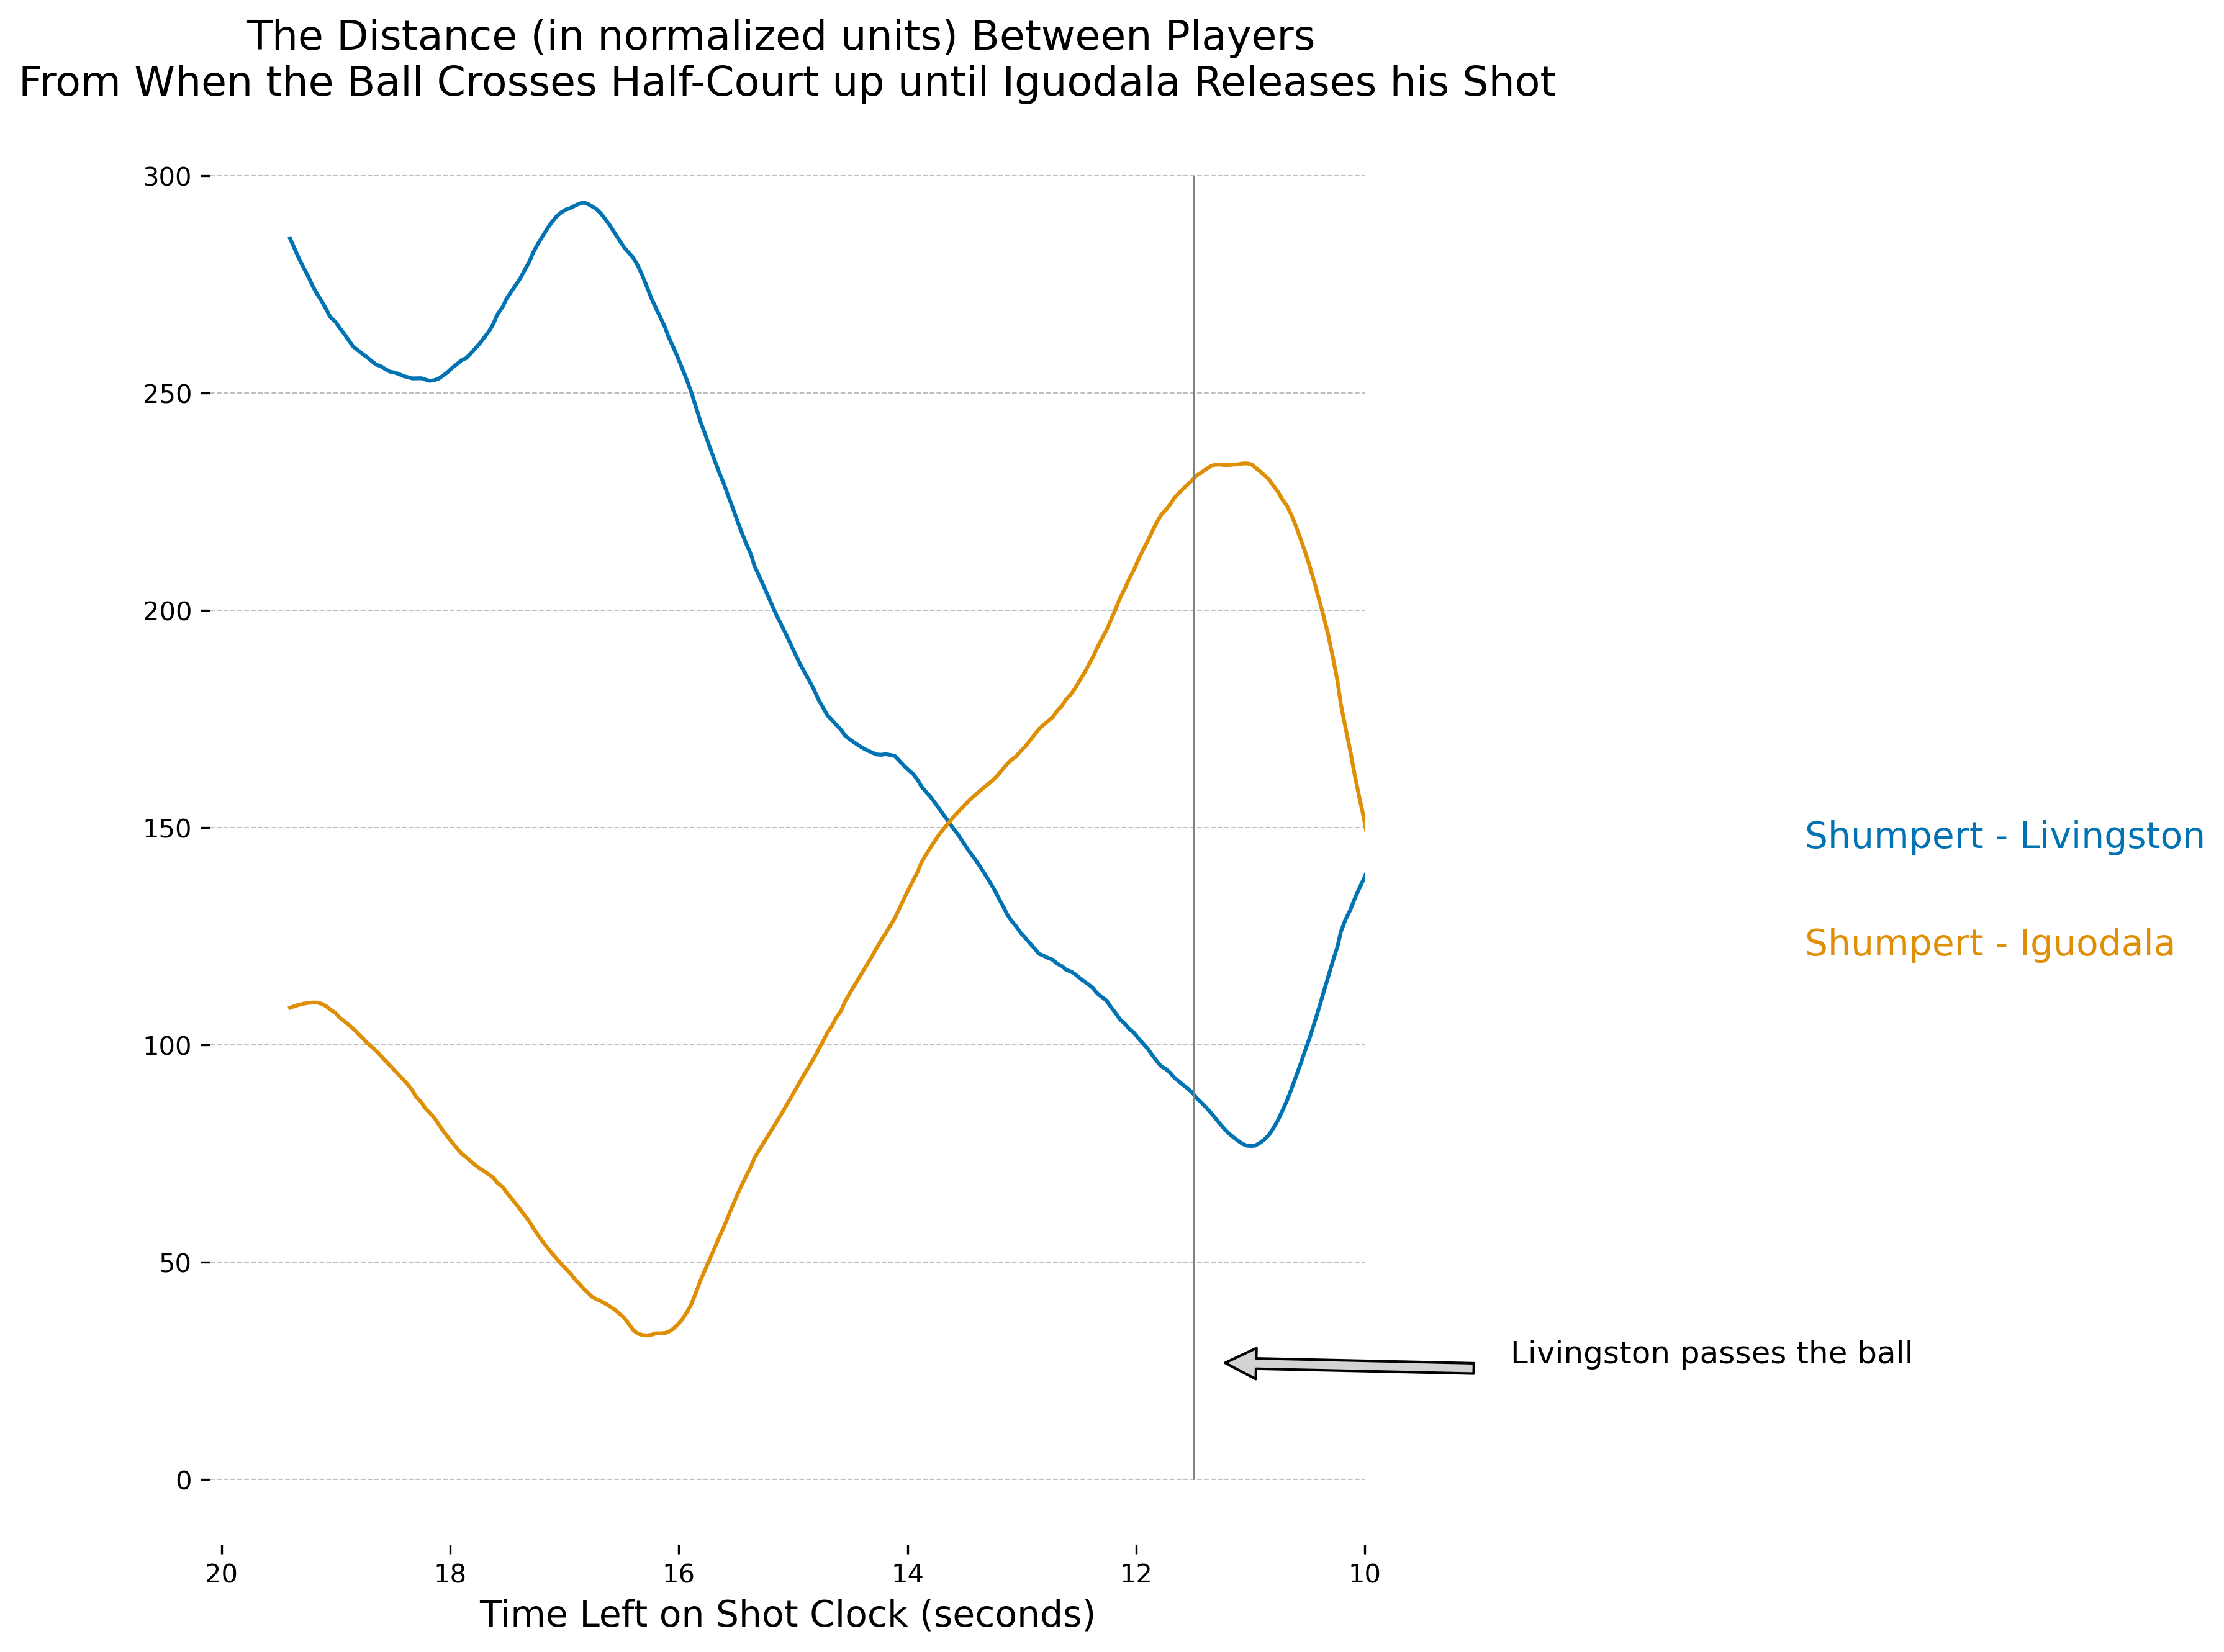
We can clearly see the gravity that Livingston is creating. Regardless of whether this is bad defense or not, with the last possessions still fresh in mind, the threat of Livingston's shotmaking causes Shumpert to lose his man. Leading to a great look for the Warriors from 3 that Iguodala converts.
It is hard to find full NBA games on YouTube, and it's illegal to use Leaguepass videos without the NBA's explicit consent, but in the future I hope to be able to include side-by-side video analysis with tracking data!